Understanding the End User with Journey Mapping
One of the most valuable tools in the design thinking process is journey mapping. It is an exploratory tool that provides ideas for further development. A journey map displays the experience – ideal or actual – a user has with a product or service. It forces the innovation team to experience the product or service from the perspective of the end user and build empathy for the user. The user’s journey with a product or service is graphically represented and allows the design team to focus on the positive (high) and negative (low) points of that experience. These contain the key to value-added innovation. The map can even help to mitigate risk in a project by providing a deeper understanding of the customer experience.
The journey map needs to be executed early in the product development process. The ideal place to start is before or during ideation, or as part of a design research program. Performing the journey map exercise early in the development process allows the innovation team to generate ideas based on well-defined actual or hypothetical circumstances.
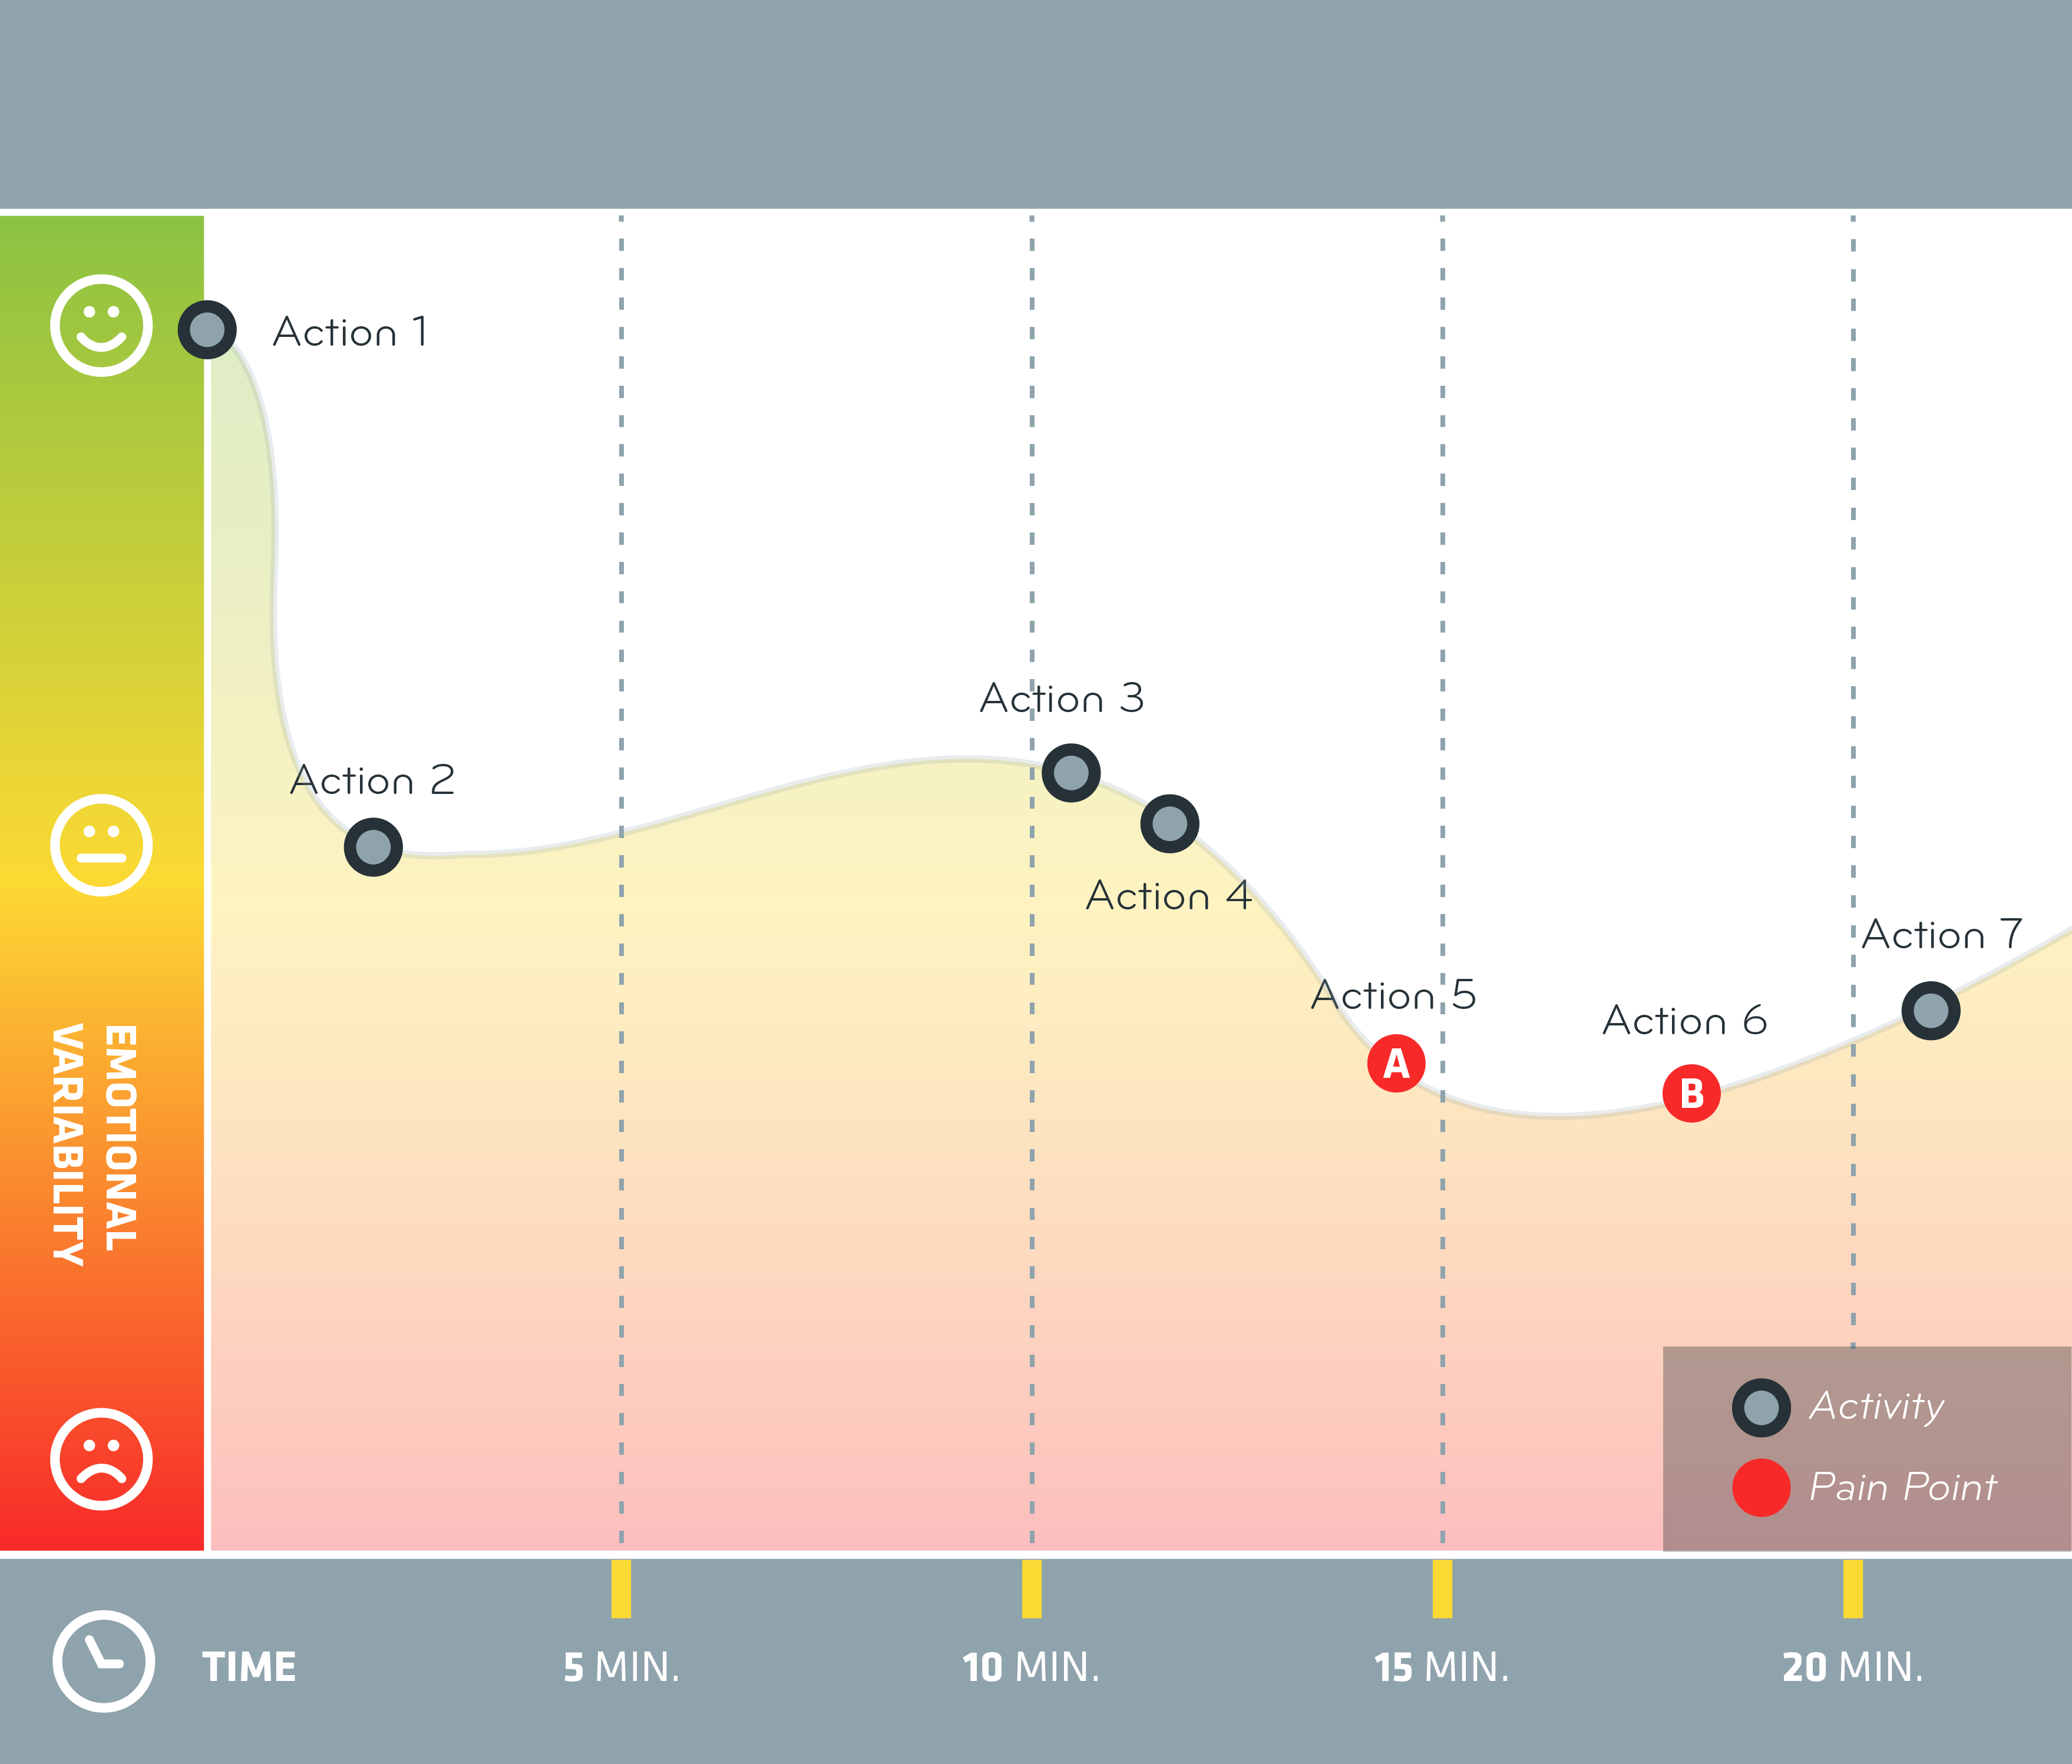
Each map contains two axes: time is represented on the horizontal axis and the customer’s emotional state forms the vertical axis. Each step the customer makes is described by four parameters: time, sequence, responsible party and emotional response.
The map can be rudimentary or have a high degree of graphic character, depending on the circumstances and expectations of the team or client. Each map contains two axes: time is represented on the horizontal axis and the customer’s emotional state (termed emotional variability) forms the vertical axis. Each step the customer makes is described by four parameters: time, sequence, responsible party and emotional response.
START YOUR JOURNEY
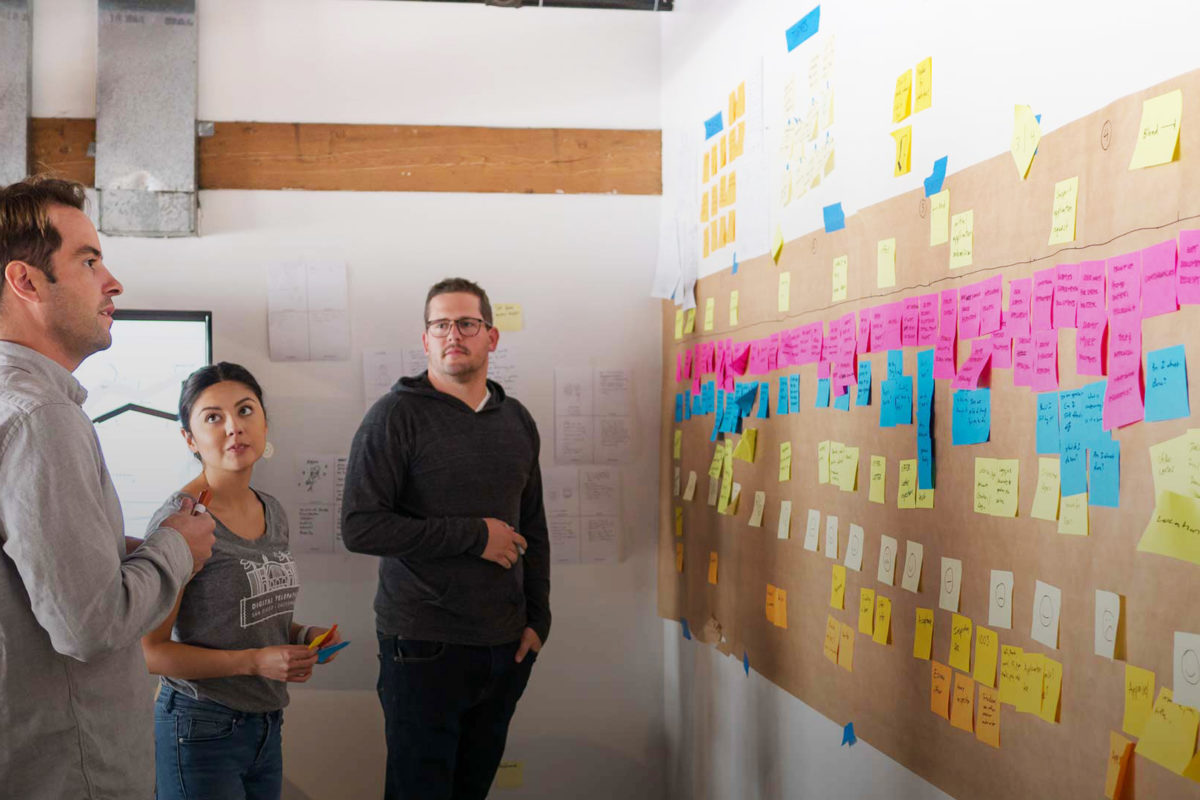
Journey mapping starts by researching the end user(s) to gain raw information about their experience with the product or service in question. This may require spending time with a stakeholder who is doing “the job.” The depth of research depends on many factors, including timing and budget. In many cases, the sample size is small but the information gathered is deep.
Journey mapping starts by researching the end user(s) to gain raw information about their experience with the product or service in question.
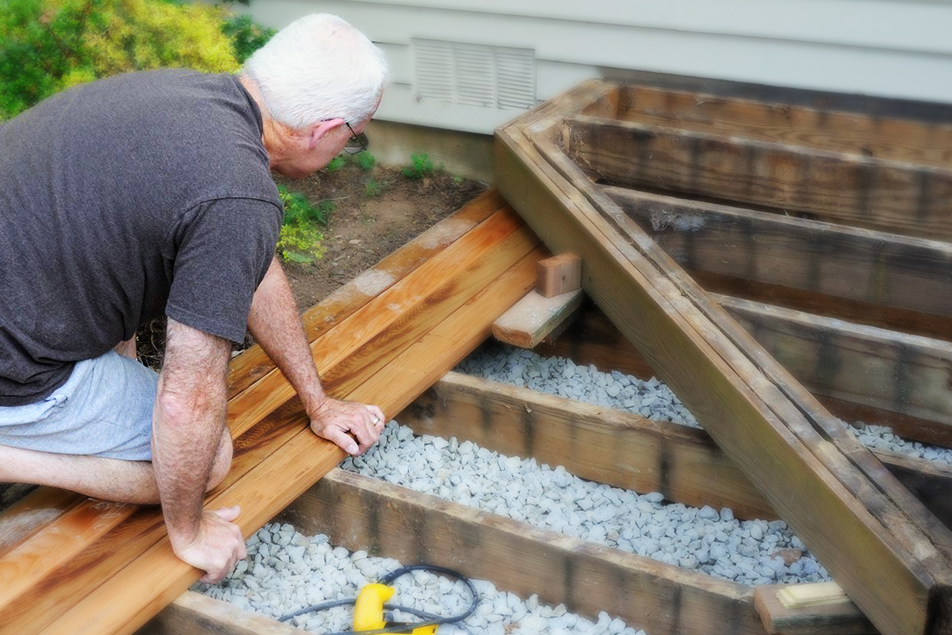
Imagine you are studying “do-it-yourselfers” who build their own decks. Information about many end user groups can quickly be found in online articles. The web is rich with information about DIY projects, reviews and experiences. You can easily perform a search query for “DIY deck building blog” and receive a wide range of results. These yield many examples of DIYer’s process, experience (positive and negative), and how they solved problems. In addition to highlighting projects, they can include reviews and links to other DIYers. There is also wealth of published information about DIYers containing related information (e.g. demographics). Information gleaned from these sources can aid the design team in creating a journey map.
Ethnography is a popular technique used to research and understand a particular group of people, and is often the preferred methodology for design research. Ethnographic research typically includes observing, interviewing and documenting participants’ behavior and experience.
Note: Observation is key. It is very important to observe a participant’s actions and behavior with the product or service rather than relying only on interviews. Often there are discrepancies between what users say they do and what they actually do.
When done correctly, observational research provides insight into “unarticulated needs.” This form of user research gives the team invaluable firsthand knowledge about the targeted group.
The length of time captured on the map depends on what the end user is doing. Someone picking up convenience store items like milk or bread might take 30 minutes versus buying property or earning a college degree, which may need to be plotted over months and years. In the case of the deck builders, it might take a few weeks to months. The user being observed and the tasks they are doing will determine the time interval covered by the map. Process time can also vary between different users performing the same activities.

Diligent documentation (photographs, video, and notes) helps prevent important observations from being overlooked or forgotten.
The quality of data gathered is important in determining the quality of journey map. Diligent documentation (photographs, video, and notes) helps prevent important observations from being overlooked or forgotten. The observations may yield common themes, outliers, moments of truth, high points and pain points of the user’s experience with the device or service. It is important to record details about all aspects of a user’s journey.
A researcher must, at the very least, document the user’s activity, a description of their behavior, their relative emotional state (positive or negative) and the elapsed time at each step of the process.
DESIGNING THE MAP
The journey map encompasses the user’s scope of tasks. The initial hypothetical map is revised based on knowledge gained from the ethnographic surveys. The first plot (step) on the graph will be identified from the initial research. It is typically an action that is identified as the start of the journey. In the DIY deck example, the journey didn’t begin at the lumber yard or when the first boards were measured and cut. The journey was triggered by the wish for a new deck after noting the existing deck had finally succumbed to the elements.
The number of steps (plots) depends on the user’s process revealed by the research. Some users may have more steps in their process than others. For example, in making coffee, different users will have different processes depending on the type of machine, coffee, quantity, etc.
Tasks are placed on the timeline (horizontal scale) while the emotional variability (vertical scale) indicates how the end user was feeling upon completing each step.
Insightful journey maps include details that highlight customer behavior which is unique or interesting.
Activities that are emotional highs or lows must be featured with a short description of what happened. A moment of truth as to how to operate a product, a user handling a product in an unintended way, or a customer achieving a specific goal through the use of a product, all are plot points on a map which are worthy of short elaboration. The elaboration is brief, with a few comments near each task to highlight an important finding and how it impacted the task being performed.
MAP ANALYSIS
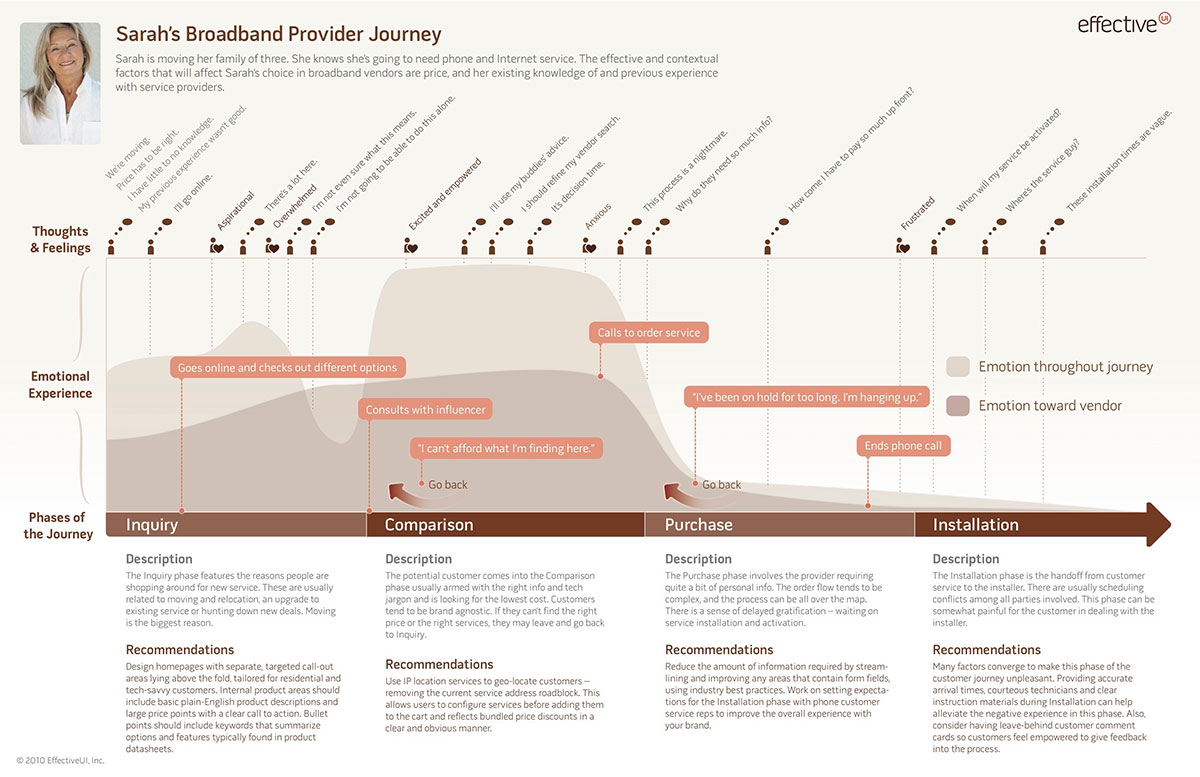
Journey map example: The process of selecting a broadband provider
Once the steps of the process have been plotted, connect the steps with a line to represent the journey. The low points on the customer’s journey are considered pain points. These pain points are insights that are incredibly valuable to the team conducting design research.
The pain points represent problems a design can solve; they provide the fuel for future innovation and have the potential to eventually become the areas for profitable growth and innovation.
However, don’t ignore the high points; these may represent parts of the journey the user can’t do without, or perhaps the reasons the user is selecting the product in the first place.
Identification of high and low points is a way for the organization to gain insight on how the end user works with the product or service it provides. The more pain points identified, the better. This is where having a good strategy, well-structured portfolio and commitment to change come into play. Easy fixes that have a high ROI should be the first priority of innovation.
TIMING IS EVERYTHING
Well, sometimes.
Sometimes journey maps result in an interesting finding: it’s not the activities that are painful, but rather the amount of time it takes to complete the process.
For example, I developed a journey map that highlighted a process that was supposed to take only five minutes. However, the support activities before and after the five-minute activity amounted to 45 minutes of other tasks, including cleaning. That said, compared to the journey maps of competitors’ products, a 50-minute process was still a major improvement. Be aware of time, and make sure you analyze this important factor within the right context.
CAUTION!
Remember: journey maps do not prove anything; they are tools, not market research. They are best used to help design teams come up with ideas for further investigation and prototyping. The tools themselves do not replace analysis, so be careful to not announce a quick victory from their results. Analysis takes patience, thoughtfulness, and reflection on what has been learned.
REACH YOUR DESTINATION!
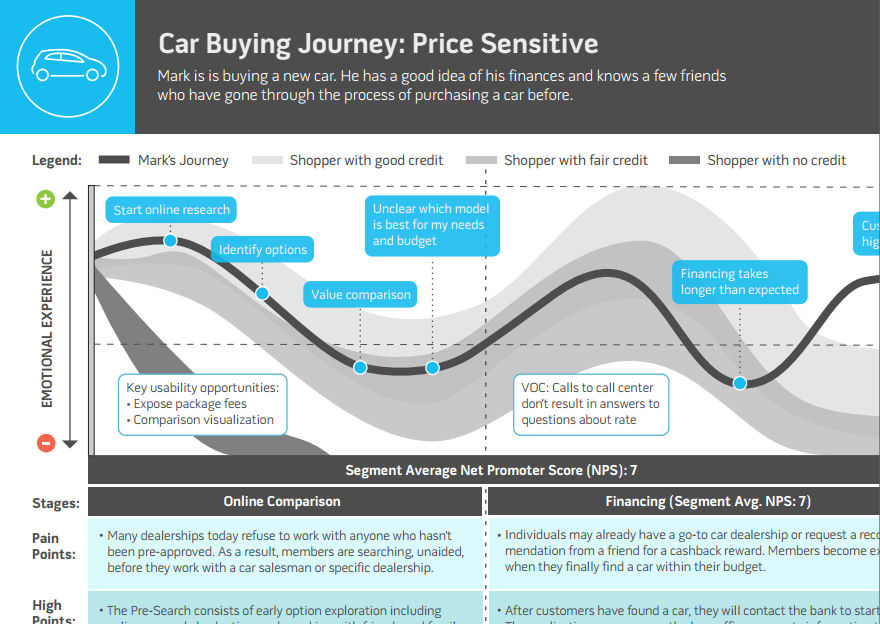
Journey map example: The process of buying a car
Journey mapping is a way to understand the user and user research in a visual way. It allows design teams to reflect on the customer experience in multiple dimensions, notice trends among multiple customers who have been part of the process, and to help create the ideal journey based on pain points discovered on the way. Among the tools in design thinking, journey mapping launches a design team into user-centered design. The journey map is a way for the design team to build a strong empathetic connection with the end user/customer experiencing the product or service. In the process, the end user becomes a real person, with hopes and challenges, rather than an abstract demographic.
For an organization, techniques like journey mapping help bring it new knowledge. It opens the first phase of the knowledge funnel. It can be ambiguous, because the mystery has not been explored yet. An organization needs to be both intuitive and analytical with the portfolio of ideas derived from journey mapping in order to sustain business and advance the company. Journey mapping is one tool to explore the next level of ideas to build and prototype.